iiinsider club / Performance

The bot’s results.

A snapshot of our real-money trading.

Recorded through Sep 27, 2026

Recorded net profit

Real-money trading

+$1,313.81

After recorded trading fees. Wins and losses included.

1,929closed trade records
$8.91median bet cost · before fees
80 daysJuly 10 – September 27, 2026

Recorded bet costs ranged from $0.06 to $863.46.

Recorded win rate

78.0%of closed records
Wins
1,504
Recorded losses
425

From the bot’s own records; not independently audited. Older records have accounting differences. Past performance does not guarantee future results.

Sizing lab · Hypothetical at larger sizes

What if we bet bigger?

The same recorded trades, with every bet scaled together.

Sizing sample: Sep 21–Sep 27, 2026 · 190 closed trades. This week is already included in the lifetime total.

Bet-size multiplierGains, losses and capital at risk scale together.
Recorded median bet$23.80Before fees · largest bet $55.38
Recorded week net+$96.40After recorded trading fees
Largest trade loss that week-$49.33Historical example, not a loss limit

A larger bet does not improve the win rate. This model assumes the same fills and prices; actual liquidity, fees and slippage can change the result.

Time projection · Hypothetical at every size

What if that week’s pace continued?

What-if scenarioAdditional bot P&L · 30 days · 1× size

Hypothetical additional bot profit or loss over 30 days at 1 times the recorded bet sizes.

Same weekly paceIf that average repeated
+$413
Half the weekly paceIf the pace slowed by half
+$207
A losing scenarioIf that pace reversed
-$413

One week is too short to establish a reliable forecast. These are illustrations, not expected member returns or a likely range. Actual losses can be larger.

How the sizing math works

The sample recorded +$96.40 net over 7 calendar days. Its recorded entry costs and fees match the stored exchange fill receipts. The lifetime total includes earlier risk settings and is not used as the sizing baseline.

At 2× or 5×, every recorded position’s cost, payout, loss and fee is multiplied by that factor. The median and largest bet scale too. This is a proportional illustration, not a replay against historical order-book liquidity. Fees are not recalculated for rounding or a different fill mix. Larger orders may not fill at the same price, or at all.

For time projections, unrounded weekly net ÷ 7 × selected days × size multiplier gives the same-pace example. The other examples use half or minus that pace. No probability is assigned to any scenario. The sample includes inactive days, and its trades are not independent observations.

Bet cost is before fees, not the account balance needed to carry overlapping trades. No compounding or additional deposits are modeled; the example assumes enough capital to fund the larger positions. This tool does not determine a sufficient bankroll or a suitable bet size. Membership fees, taxes and operating costs are excluded. Member execution and results differ.

About this record

Includes all closed positions in the retained live-trade record for July 10–September 27, 2026, through 23:30 UTC. Open positions, paper trades and backtests are excluded. Each closed position counts once, even when it contains multiple contracts. Recorded losses include two expired positions booked as write-offs.

Net profit is recorded realized trading P&L after fees as recorded. Deposits, withdrawals, membership revenue, operating costs and taxes are excluded. Older records have known reconciliation differences, so this is not a complete exchange or account-balance audit. The record covers changing strategies and trade sizes; trades are not all independent observations.

Bet size means the recorded entry cost before fees, matched to each closed position. The median describes the middle bet; it does not mean every trade used that amount. Earlier trades used different risk limits, so the sizing examples use a separate recent period.

The earlier $50 → $1,000 campaign was an account milestone with additional funding and a manual adjustment. It was not a 20× trading return on an untouched $50.

Member submissions

From early access.

Browse · Open any screenshot

Selected screenshots from early-access signal traders, shared with permission. Typical member returns haven’t been established.

Owner-reported aggregate

Combined signal trades.

Cost shown
$1,598.03
Paid out
$3,387.62
Payout minus shown cost
$1,789.59

Reported as a combined early-access result. Period and separate fees are unconfirmed; the underlying trade receipts haven’t been reviewed.

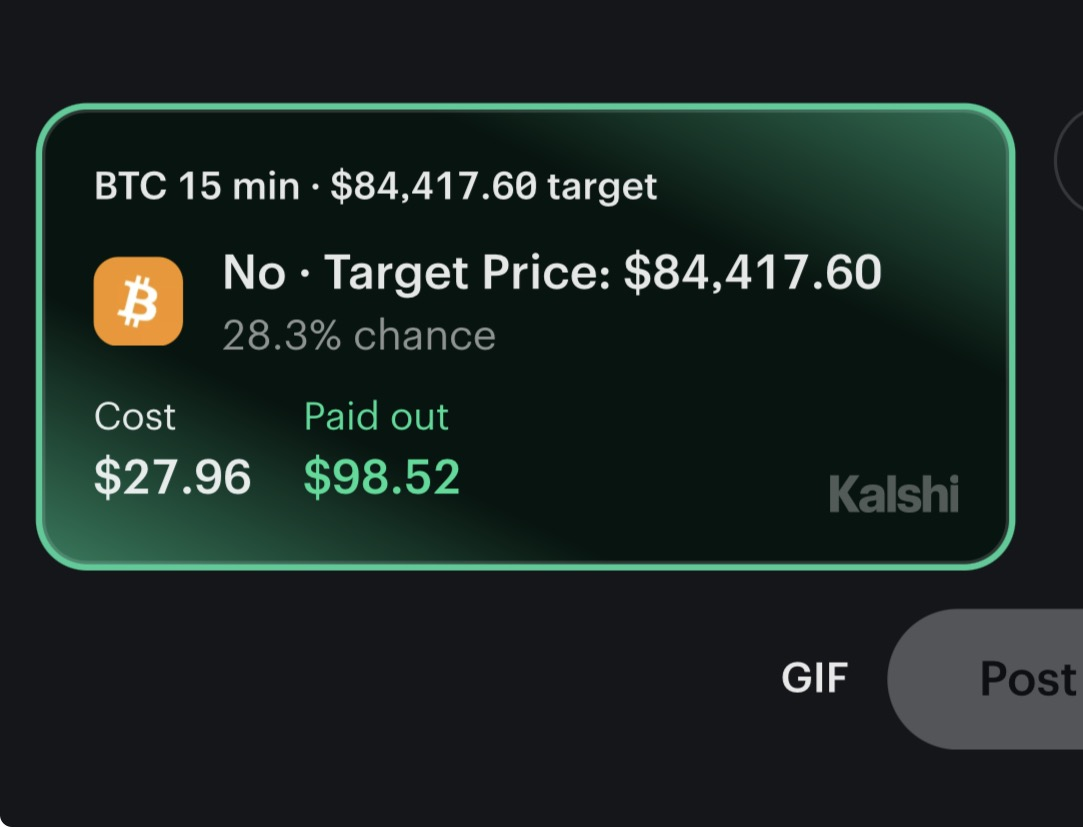
Kalshi BTC 15-minute No trade card, with a target of $84,417.60 and 28.3% displayed chance.
Trade card

$27.96 cost. $98.52 paid out.

A BTC trade. Separate fees aren’t shown.

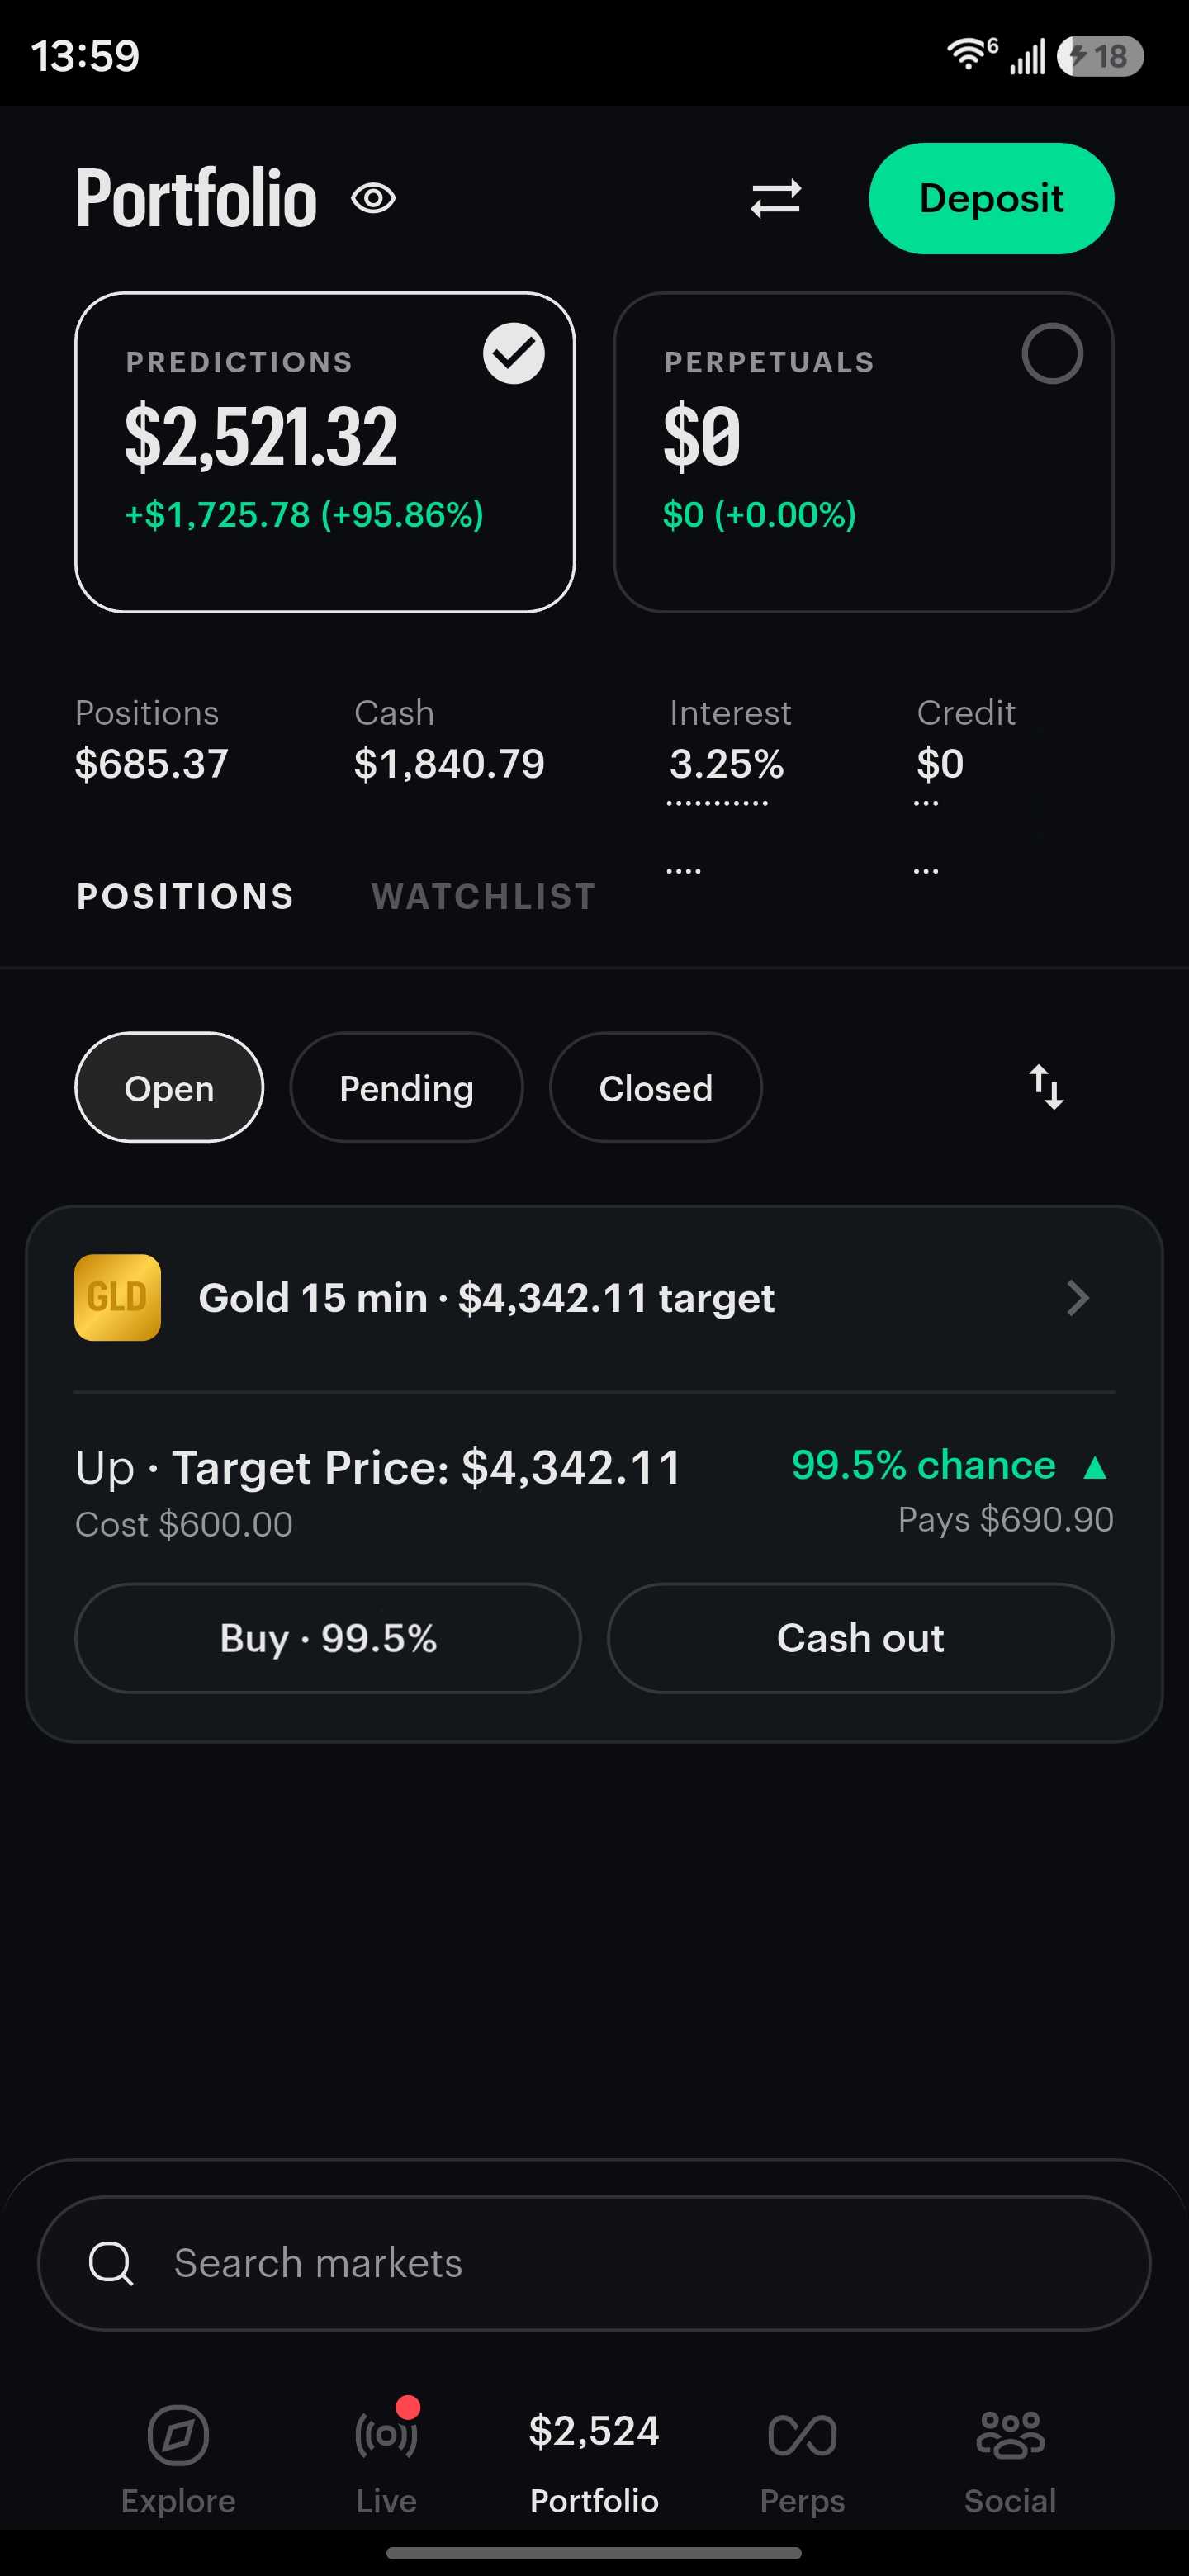
Kalshi portfolio showing $2,521.32 in predictions, a displayed change of +$1,725.78, $685.37 in positions and $1,840.79 cash. The open Gold position shows a potential $690.90 payout.
Open-position snapshot

$600 in one position.

An open Gold trade. Its payout is still unsettled.

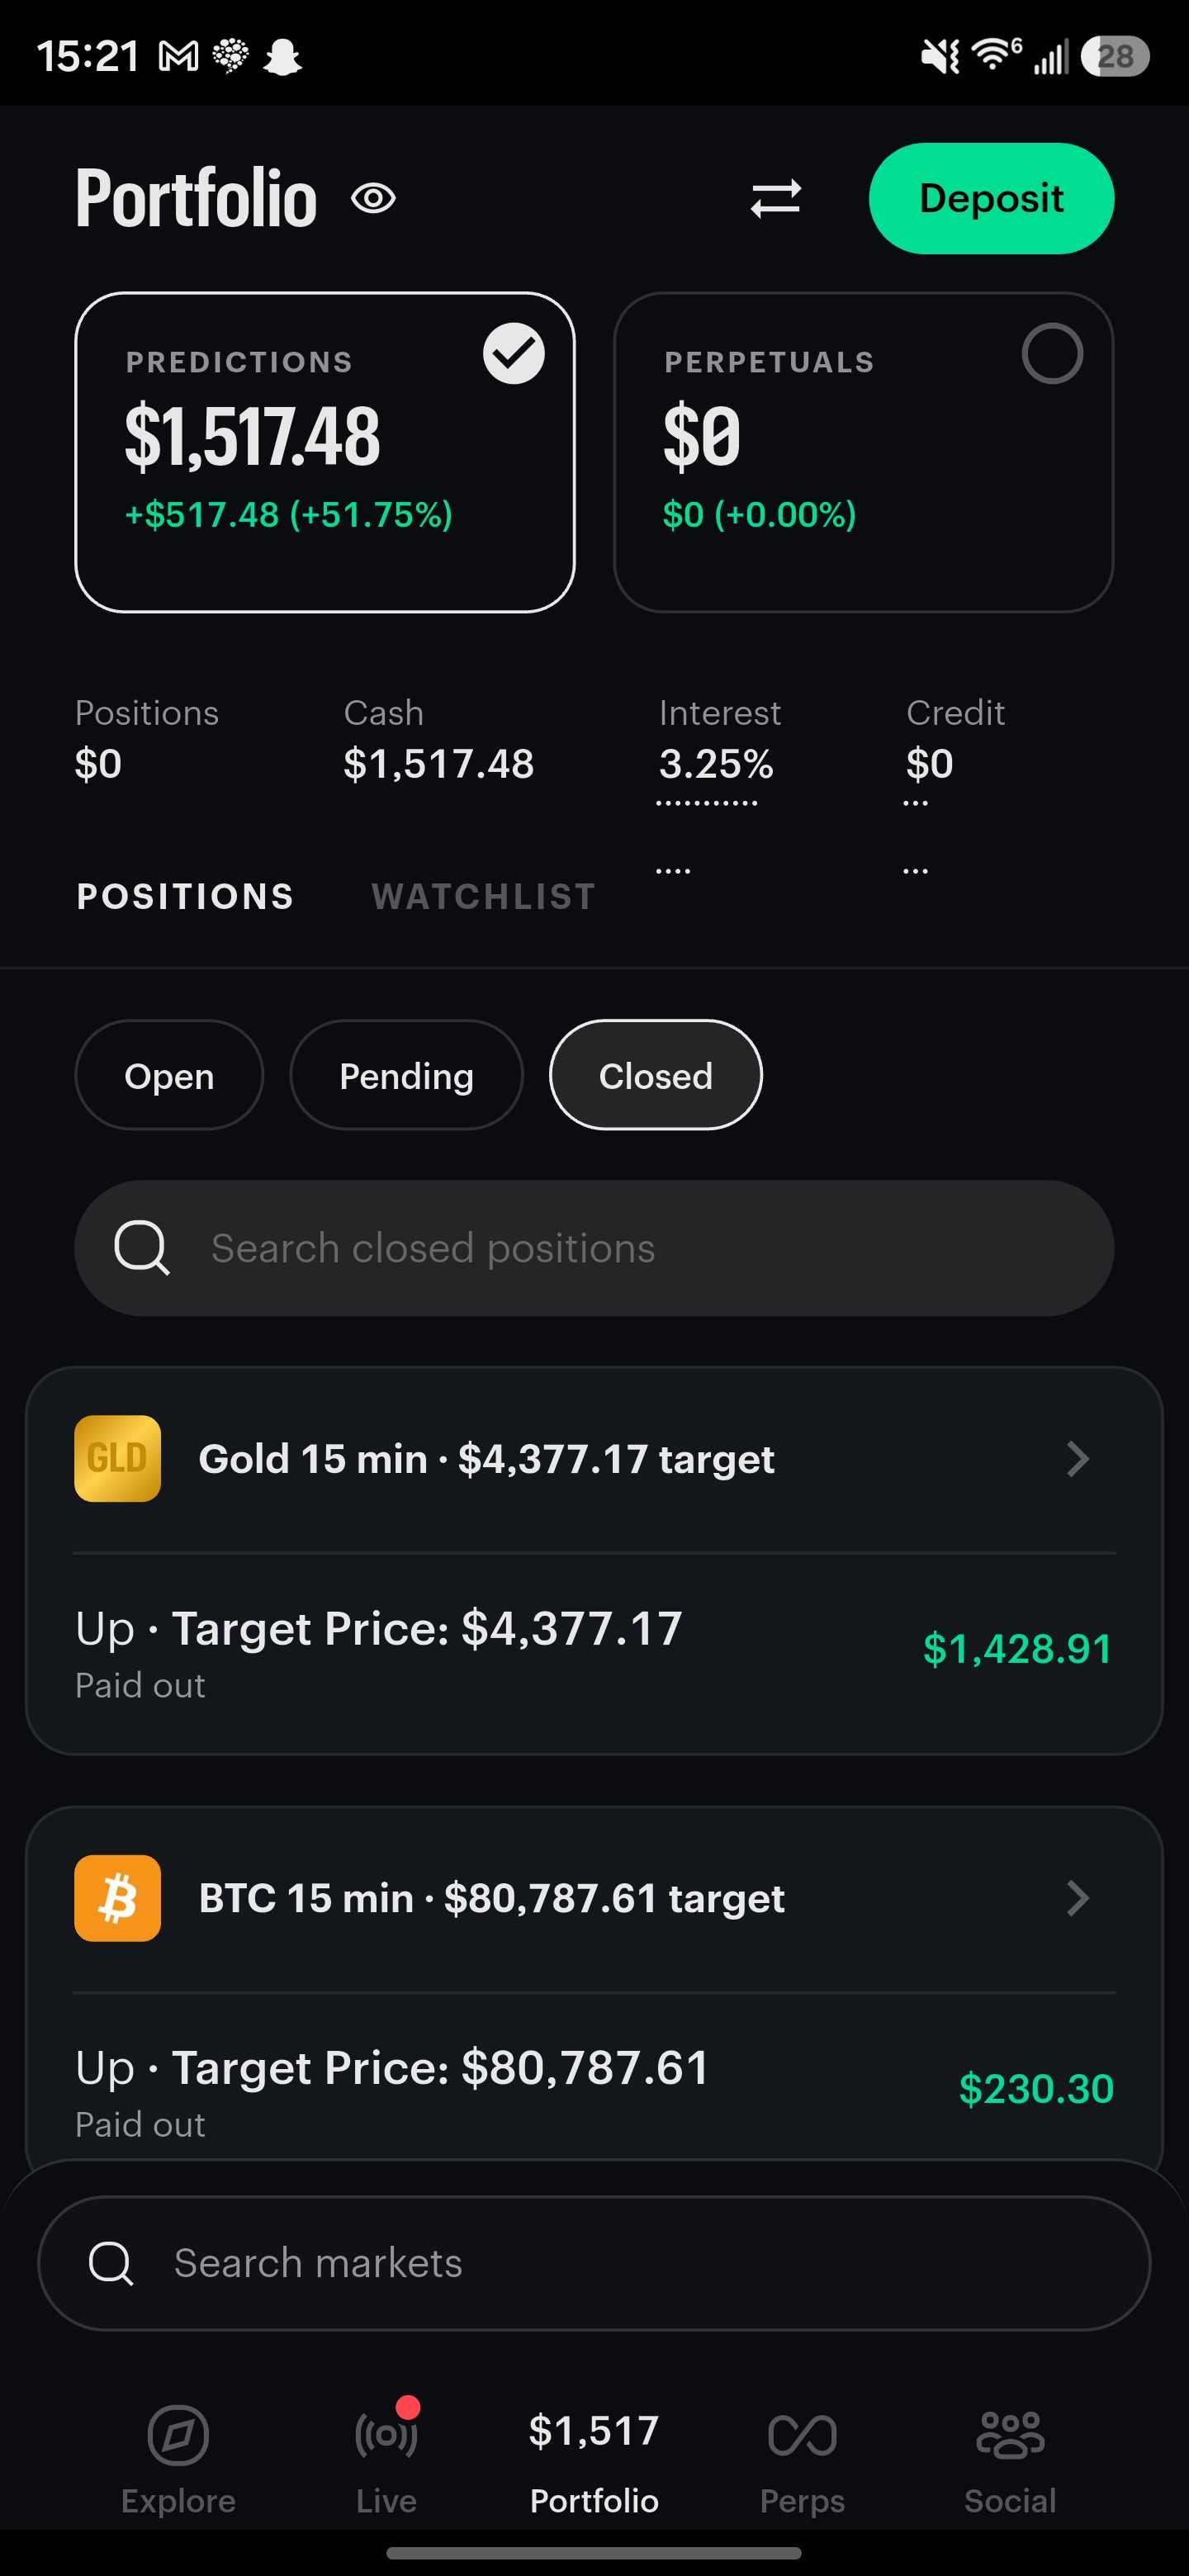
Kalshi portfolio showing $1,517.48 and a displayed change of +$517.48, with closed Gold and BTC positions showing payouts of $1,428.91 and $230.30.
Closed-position snapshot

Gold and BTC payouts.

Payout amounts are shown; trade costs aren’t visible.

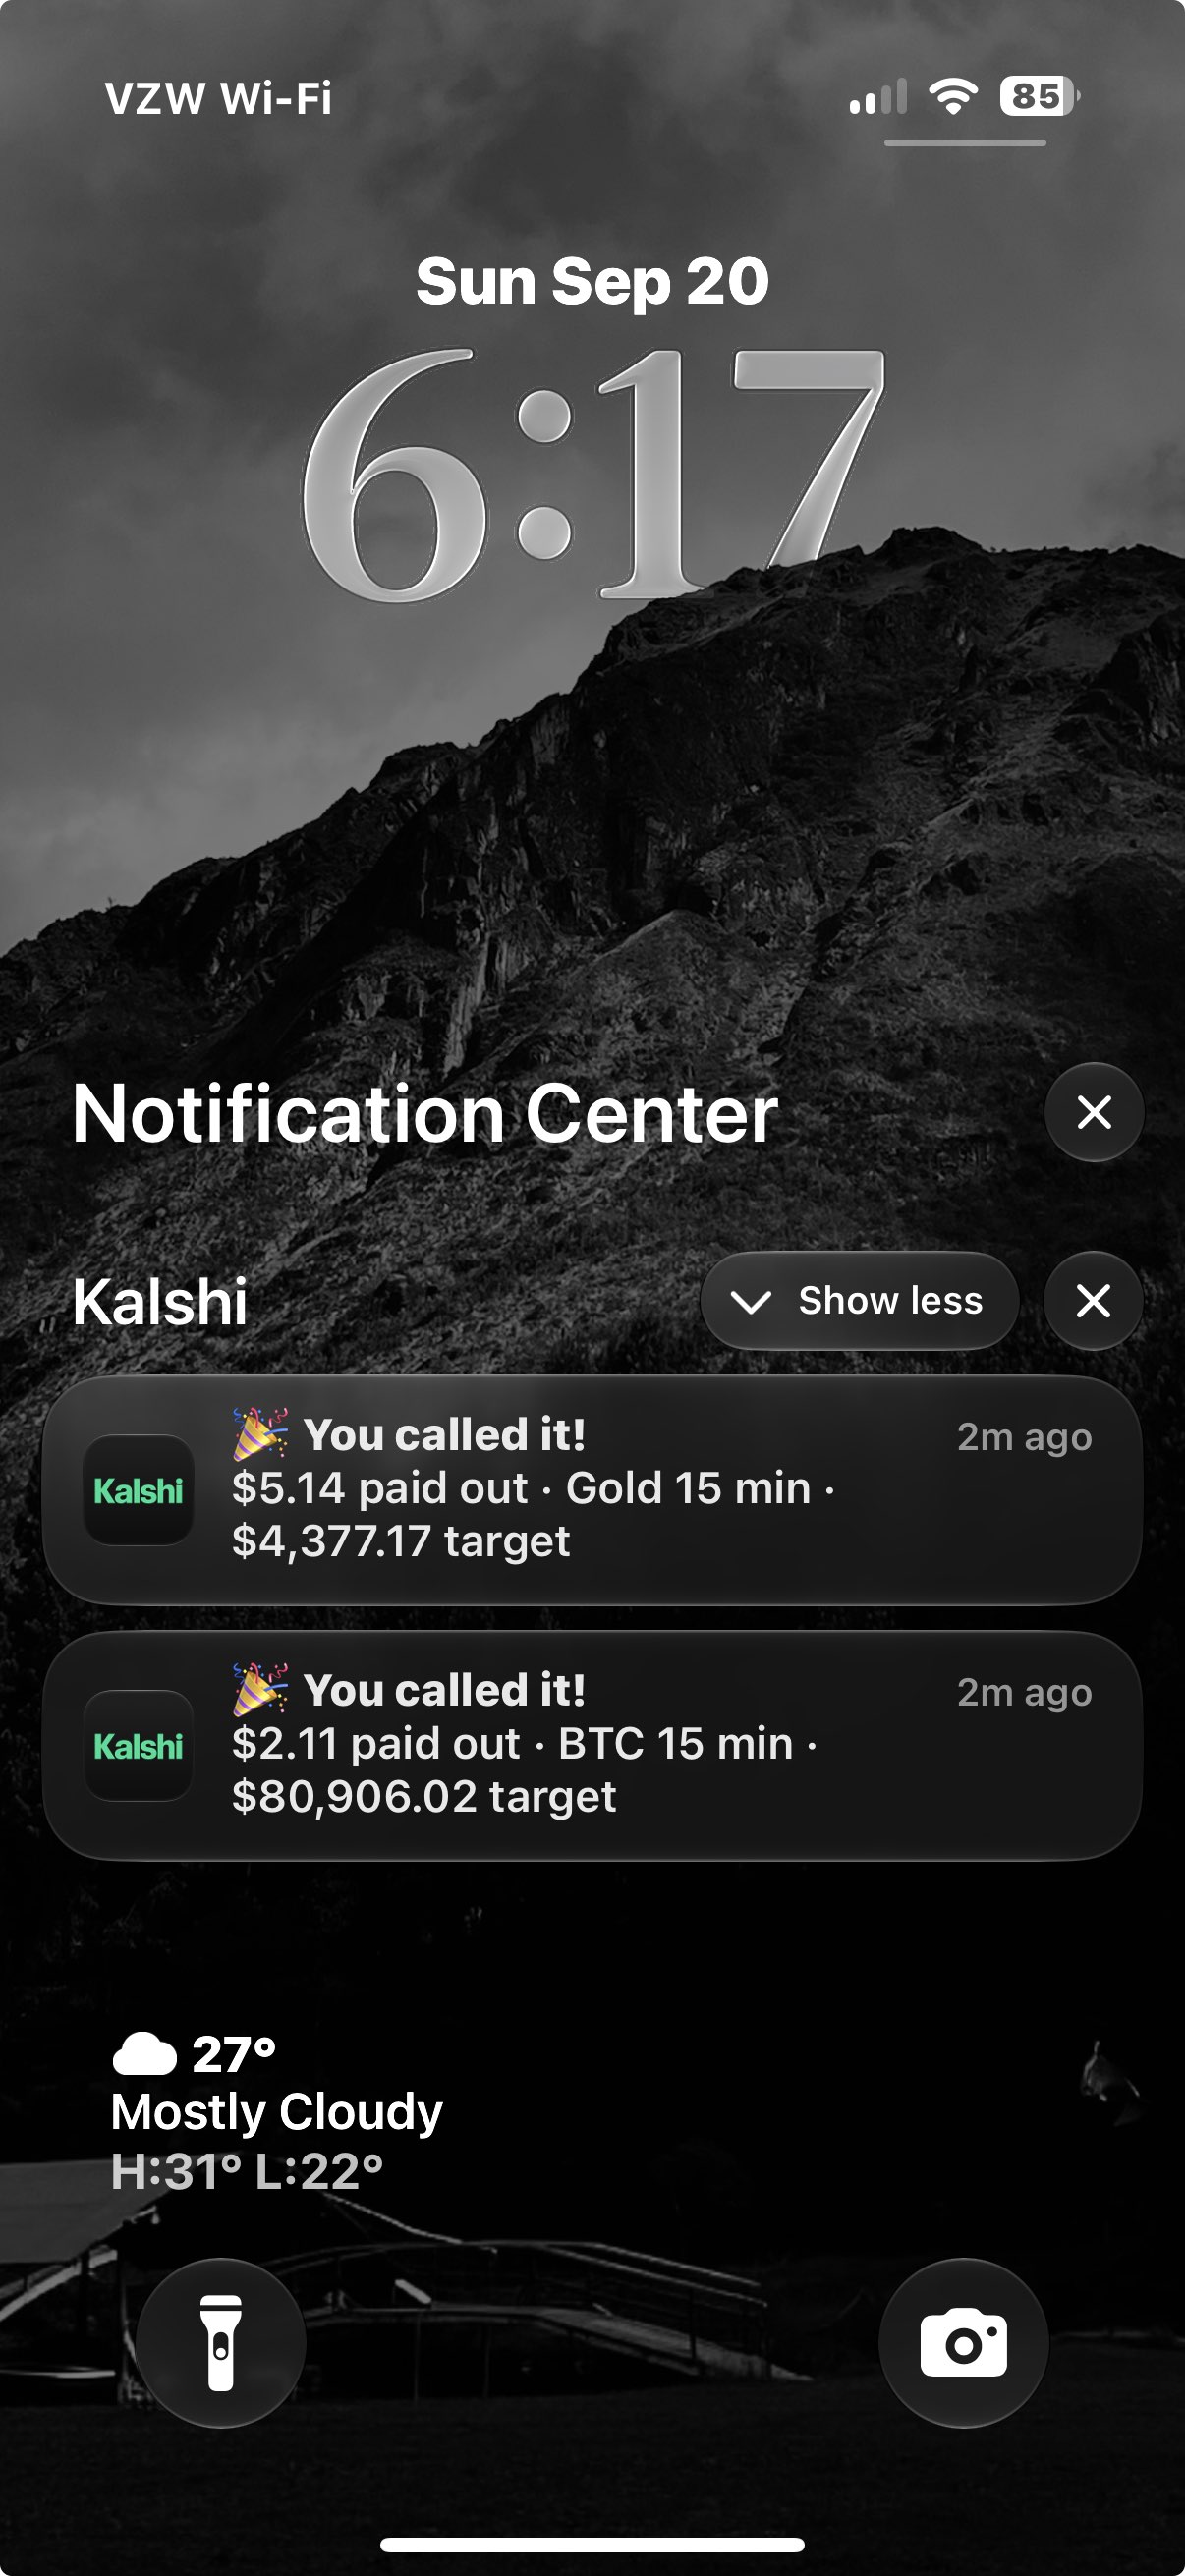
Phone lock screen with Kalshi payout notifications for Gold and BTC 15-minute trades on Sunday, September 20; year not shown.
Payout notifications

Straight to the lock screen.

$5.14 and $2.11 paid out. Stakes and fees aren’t shown.

Member submissions are not independently verified. Payouts are not net profit. Portfolio changes lack a full funding and trading history. These figures are separate from the bot’s record above.

A closer look

See what lands in your Discord.

See a signal Explore membership →